Understand JUnit Runners
JUnit is probably the most popular framework used by Java developers everyday. But many of us don’t necessarily know how JUnit works internally.
In this post I’d like to show you how to quickly understand the core concept in the test execution process - JUnit runner, by using Flow.
Create and record a simple test case
First let’s create a very simple test class named FirstTestCase.java containing two tests,
annotated with @Test.
package com.flow.test;
public class FirstTestCase {
@Test
public void firstTest() {
assertEquals(1 + 1, 2);
}
@Test
public void secondTest() {
assertTrue(true);
}
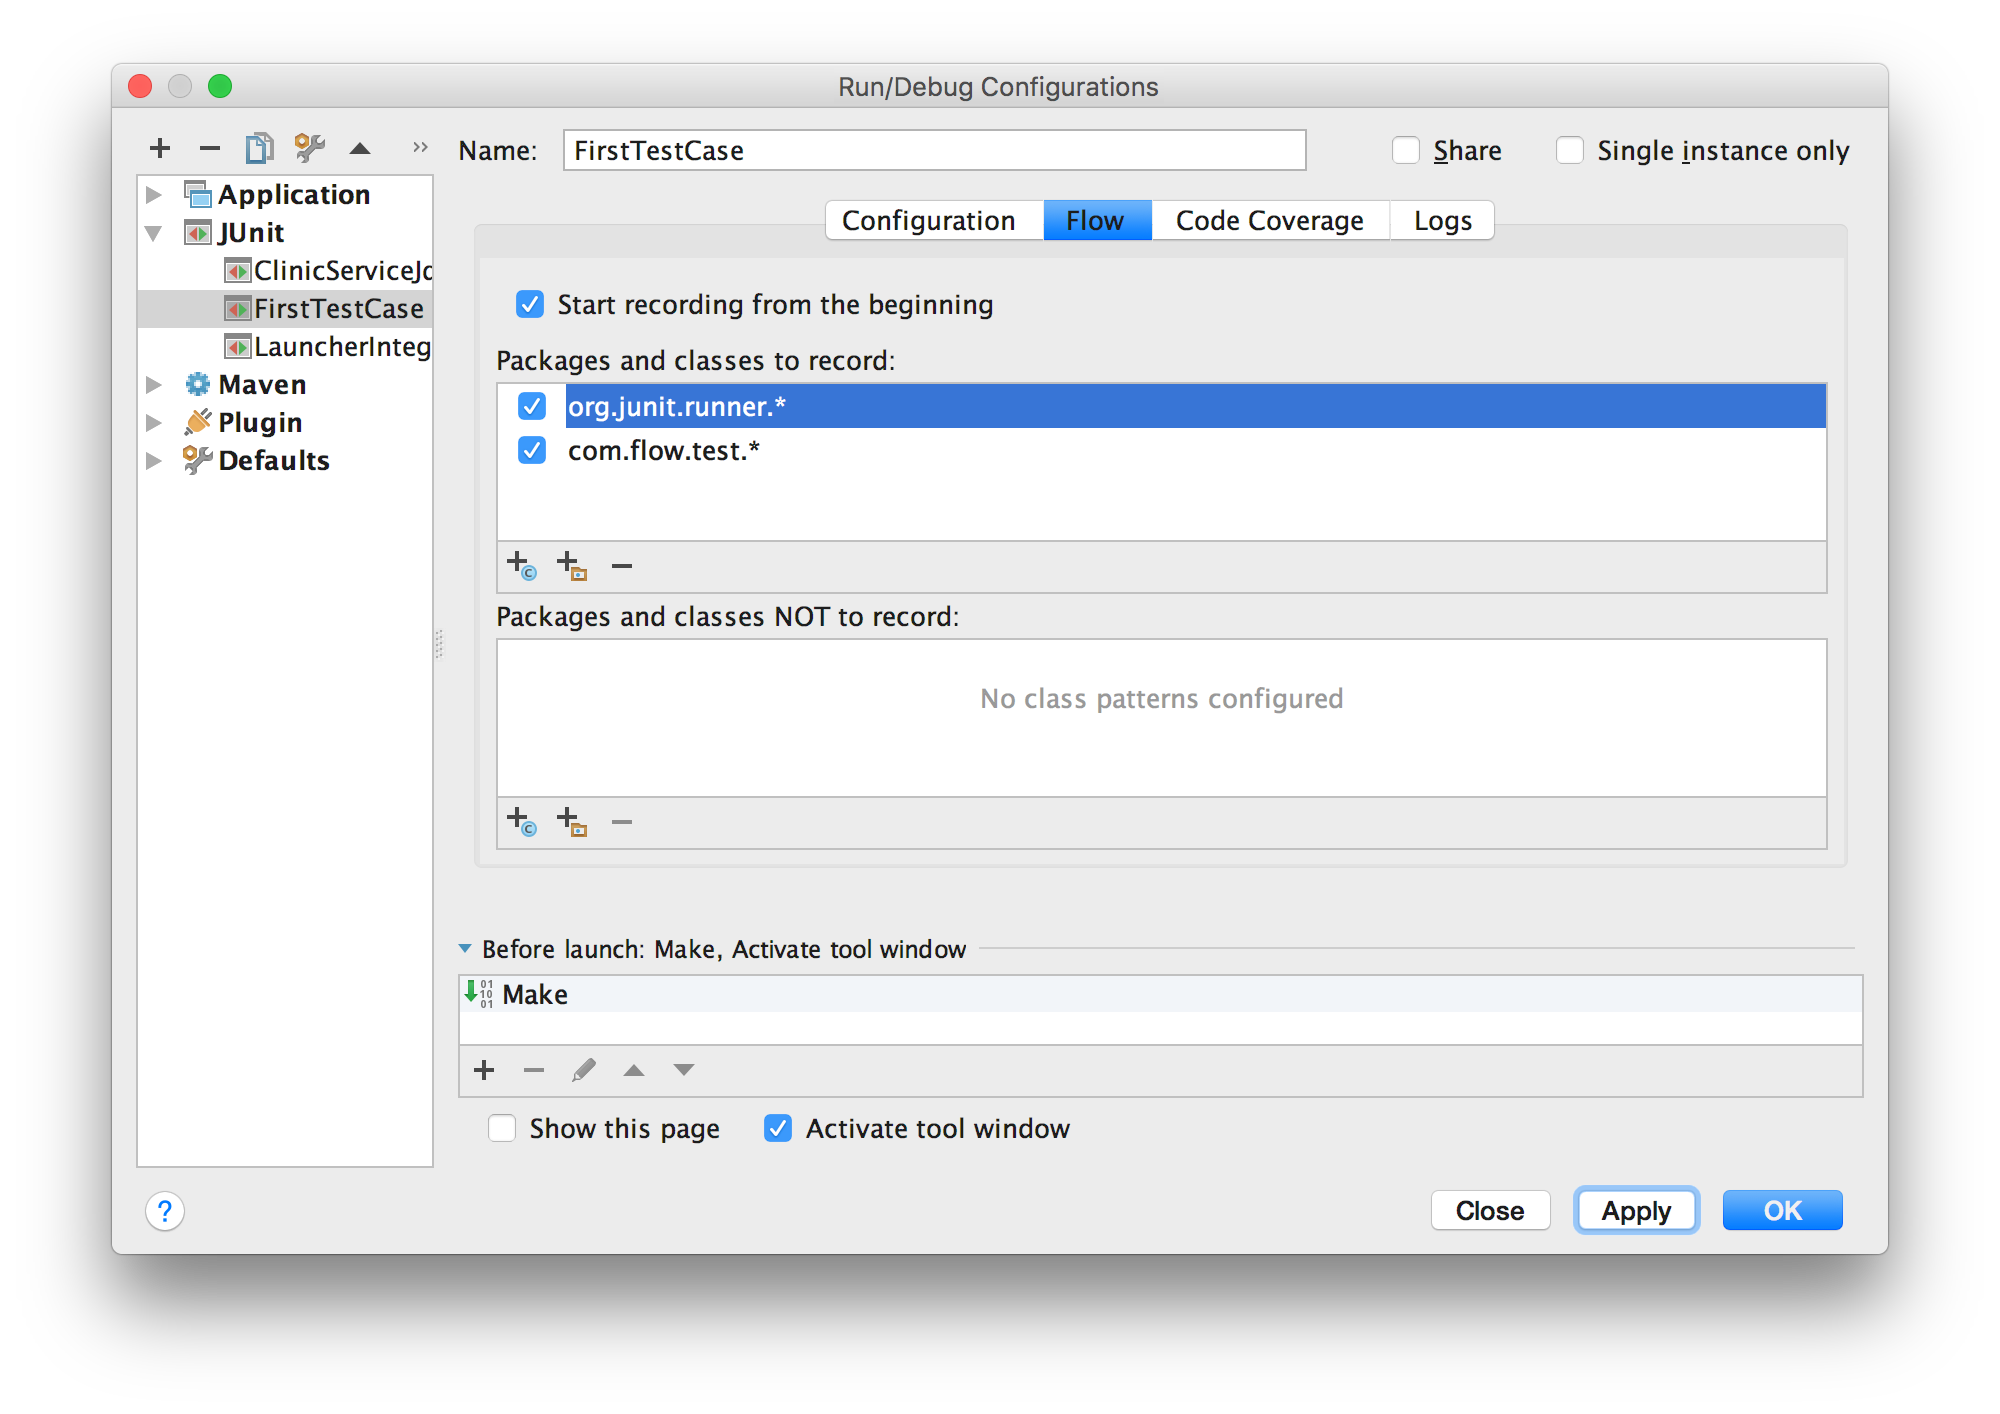
}Then I create a Run Configuration for this test in IntelliJ.
In "Flow" tab I decide to include package org.junit.runner and my test package com.flow.test.
The checkbox "Start recording from the beginning" is checked by default.
After having saved the configuration, I run the test with Flow by clicking the record button in the toolbar
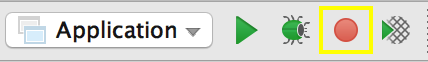 .
Flow will automatically trace all the method calls the two packages that are included from the beginning of the test.
.
Flow will automatically trace all the method calls the two packages that are included from the beginning of the test.
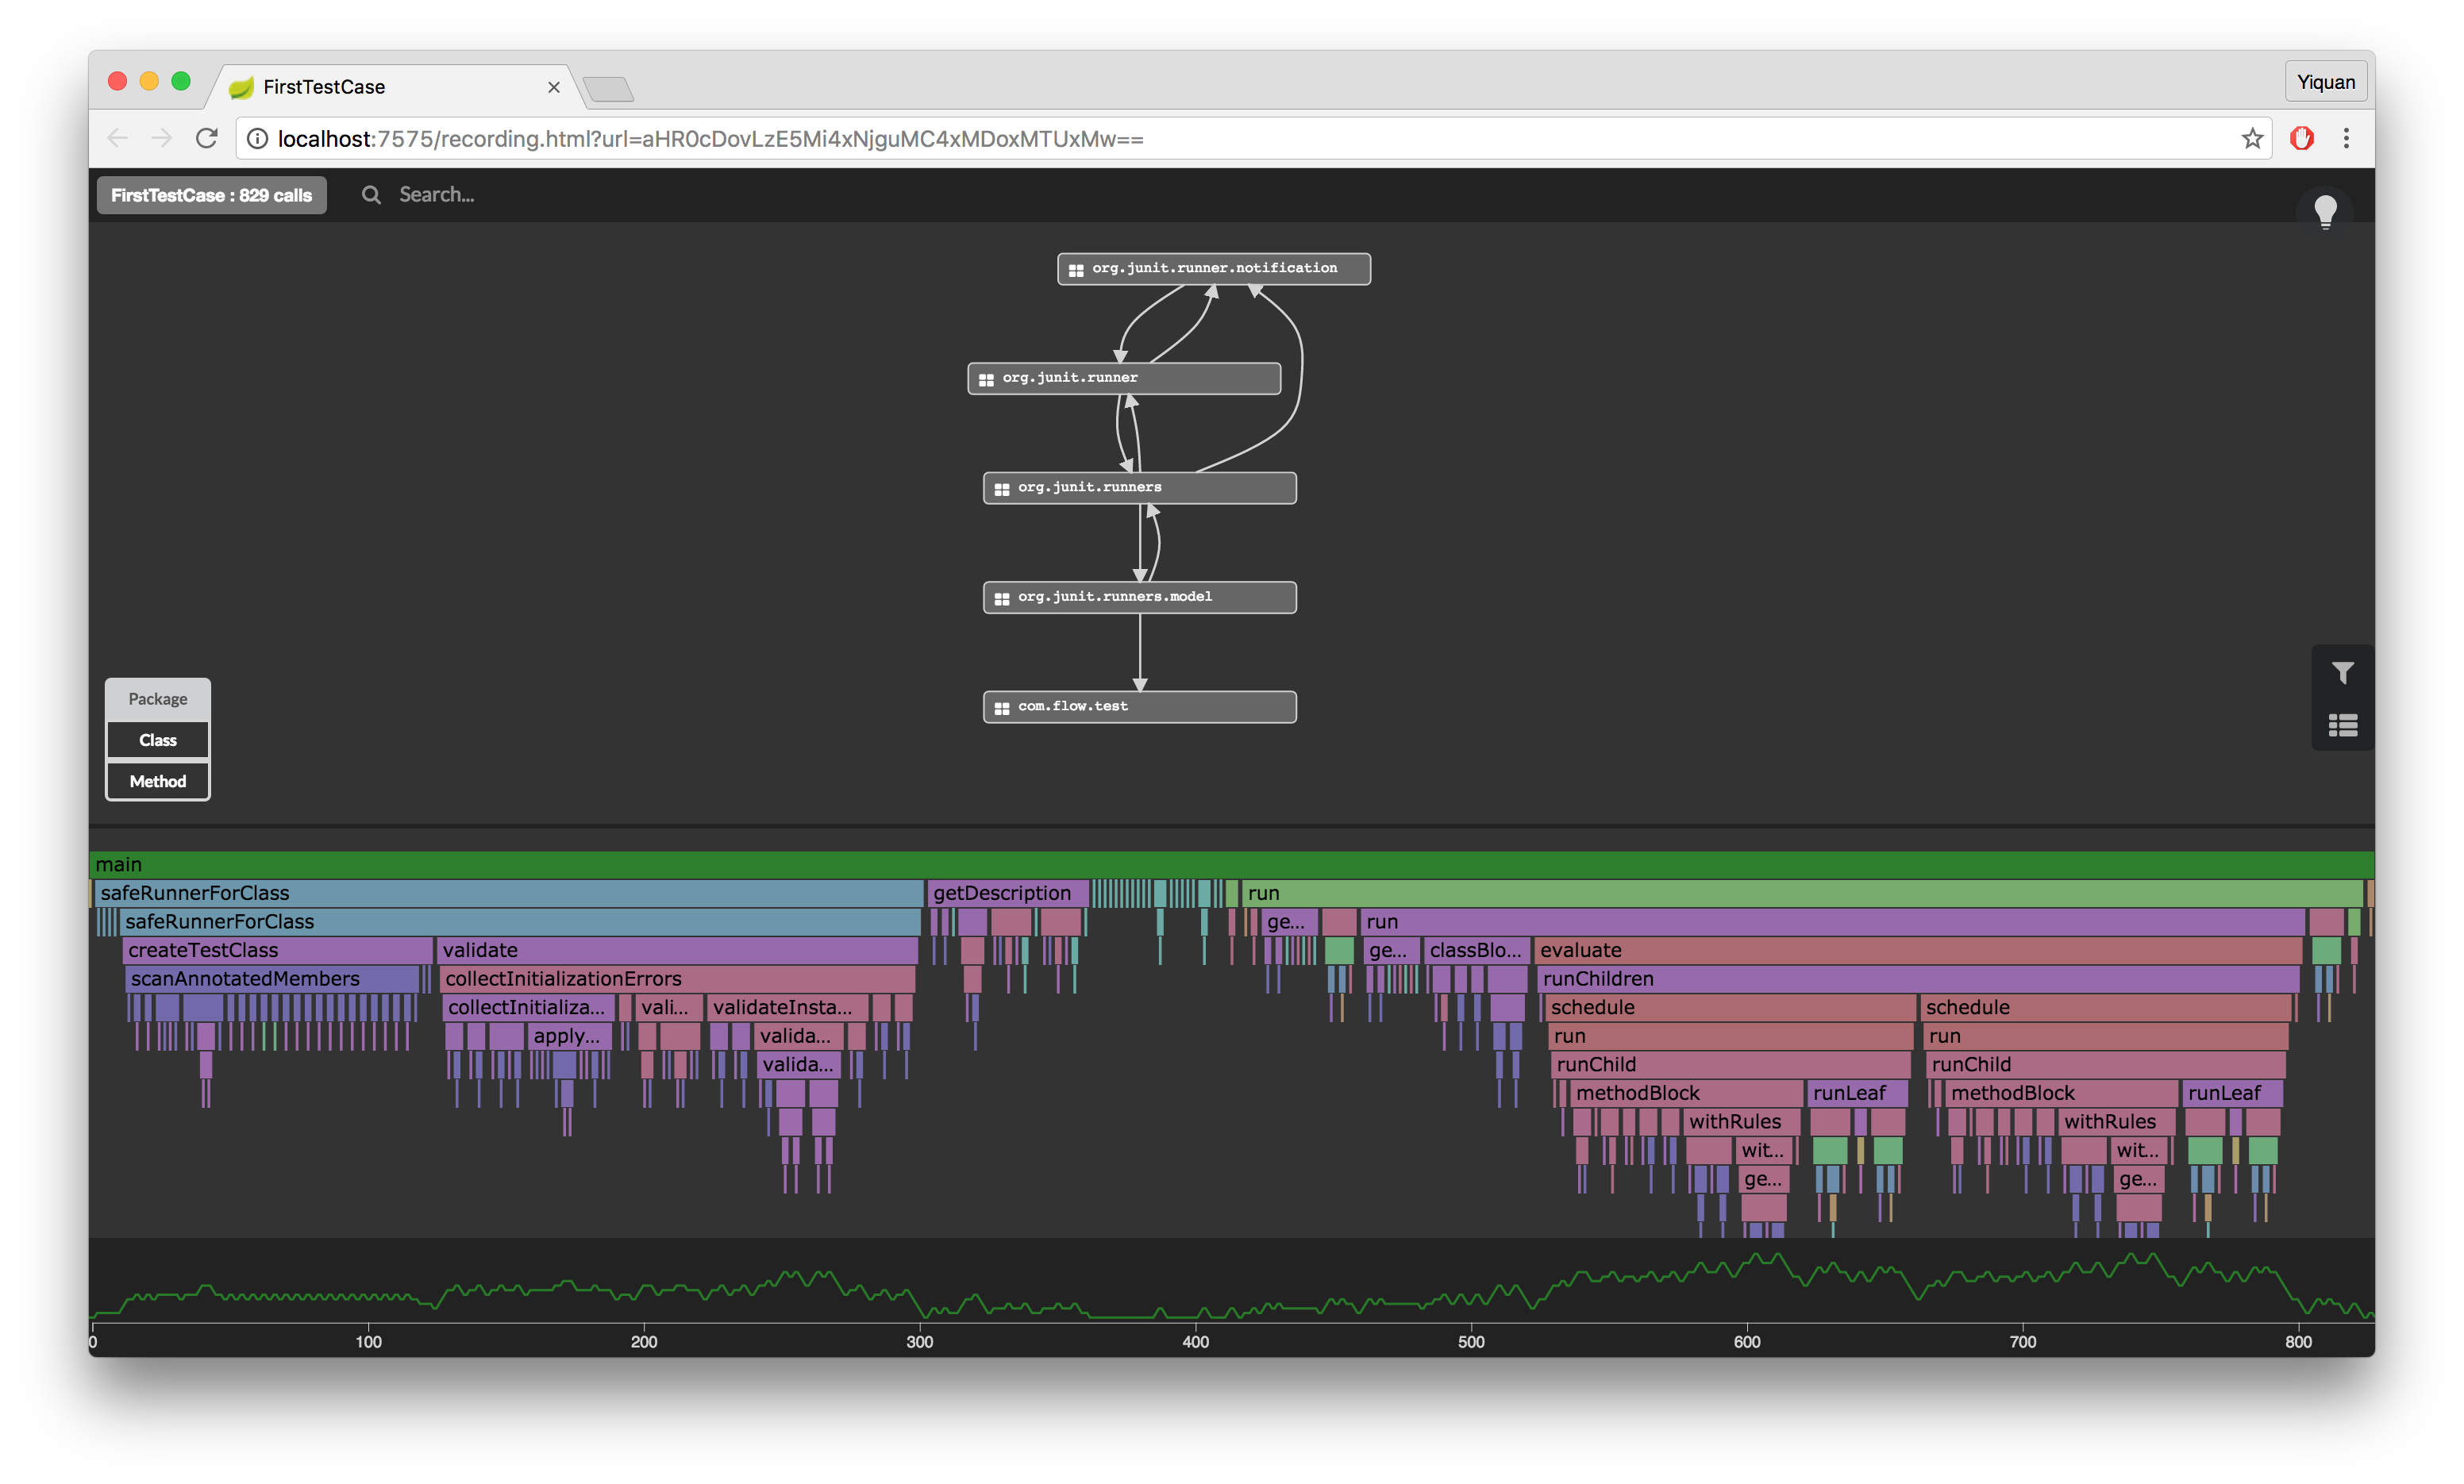
When the execution of the tests is finished, I can explore the visual representation of the execution in my browser. You can also look at it here while continuing to read the post.
Understand the test execution process
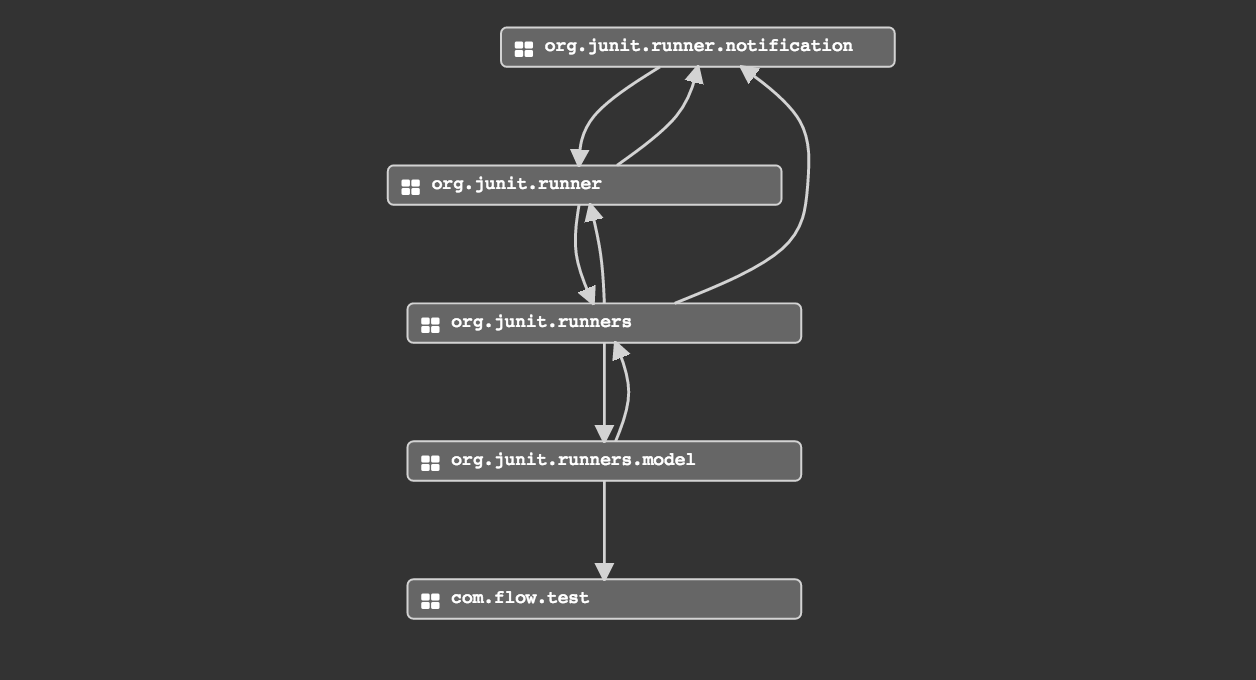
Let’s first take a look at the main packages and classes in the call graph:
-
org.junit.runnerandorg.junit.runners: These two packages contain the JUnit runner interfaces and default implementations that we will discover more in detail later. -
org.junit.runner.notification: The major class here isRunNotifierwhich is called by the runners. Listeners can be attached to the notifier that listen to events such as test started and test finished etc. -
org.junit.runner.model: We can find two interesting classes in this package,RunnerBuilderthat builds the runners andTestClassthat wraps a class to be run and provides method validation and annotation searching.
We can clearly notice two different stages in the whole test execution process through the flame chart. I decide to take a closer look at the methods executed at each stage.
In the first stage, JUnit builds the runners by calling RunnerBuilder.safeRunnerForClass which then creates the TestClass and proceeds some validations.
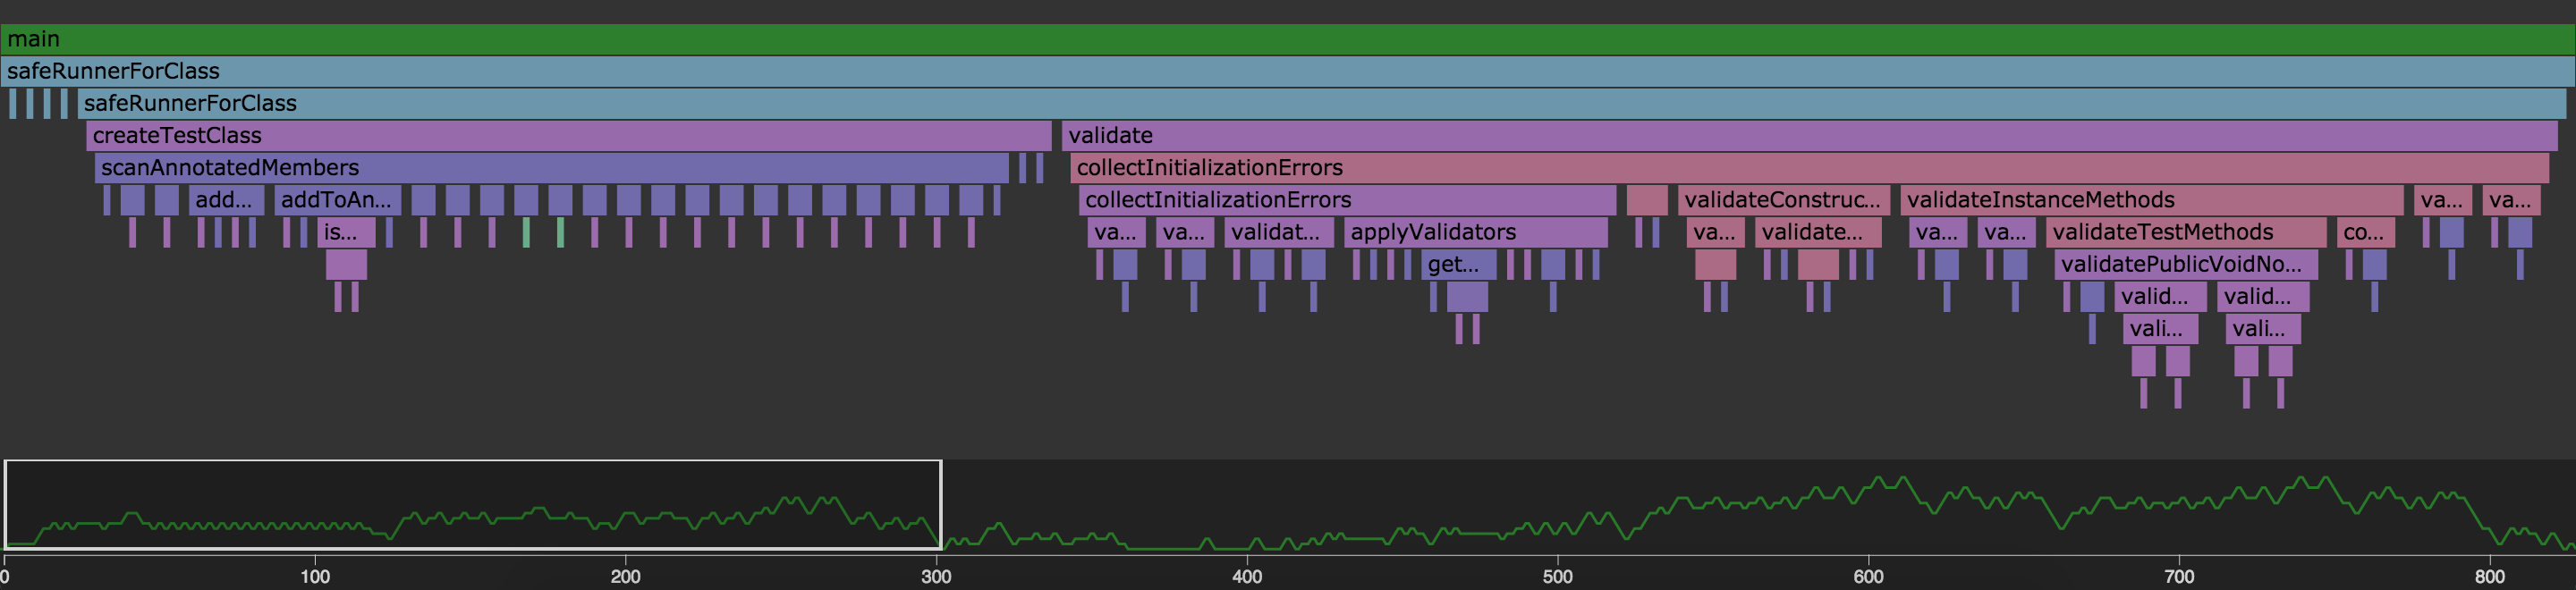
In the second stage, tests are launched in a hierarchical order (a test tree). That’s also how they are structured. You can run a test suite which contains other test suites or multiple test cases (test classes). Each test class can contain multiple test methods. Here we have a single test case including two test methods.
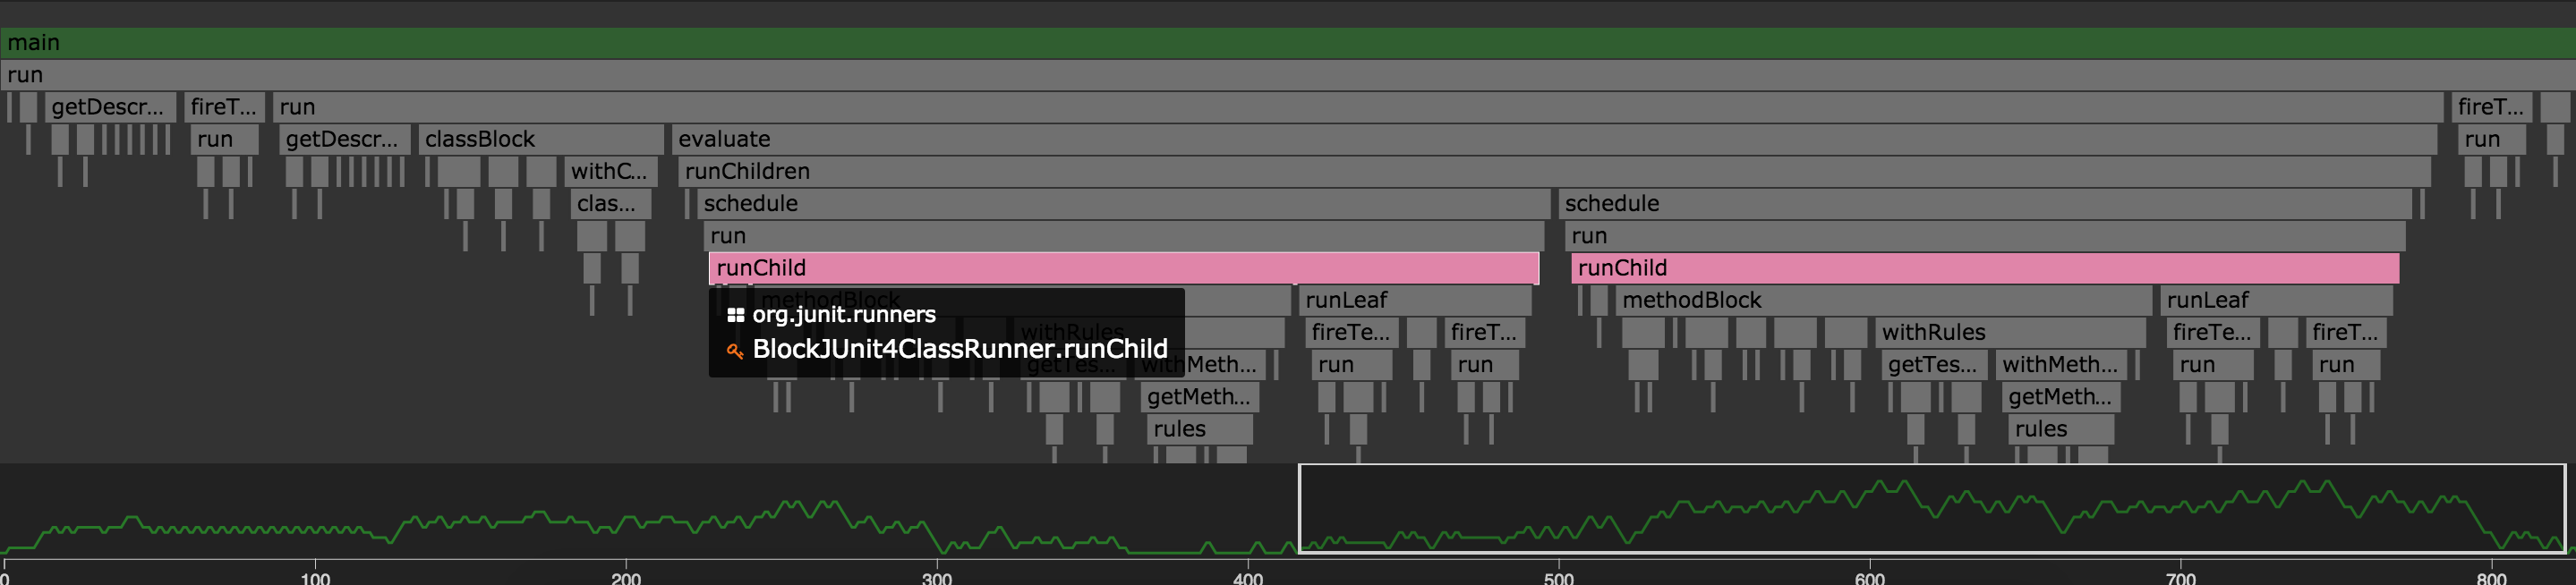
JUnitCore is the root class which uses ParentRunner to run tests. ParentRunner is an abstract base class for runners that have multiple children. ParentRunner has different subclasses.
In our basic scenario, the default runner BlockJUnit4ClassRunner is used. Its runChild method is called once for each test.
Go further with a test suite
I think it might be interesting to see what happens with a test suite. For this, I simply create another test case with one single test and then I define a test suite which contains my two test cases.
package com.flow.test;

@RunWith(Suite.class)
@Suite.SuiteClasses({
        FirstTestCase.class, SecondTestCase.class
})
public class MyTestSuite {

}
I record this test suite with the same configuration and here is what I get.
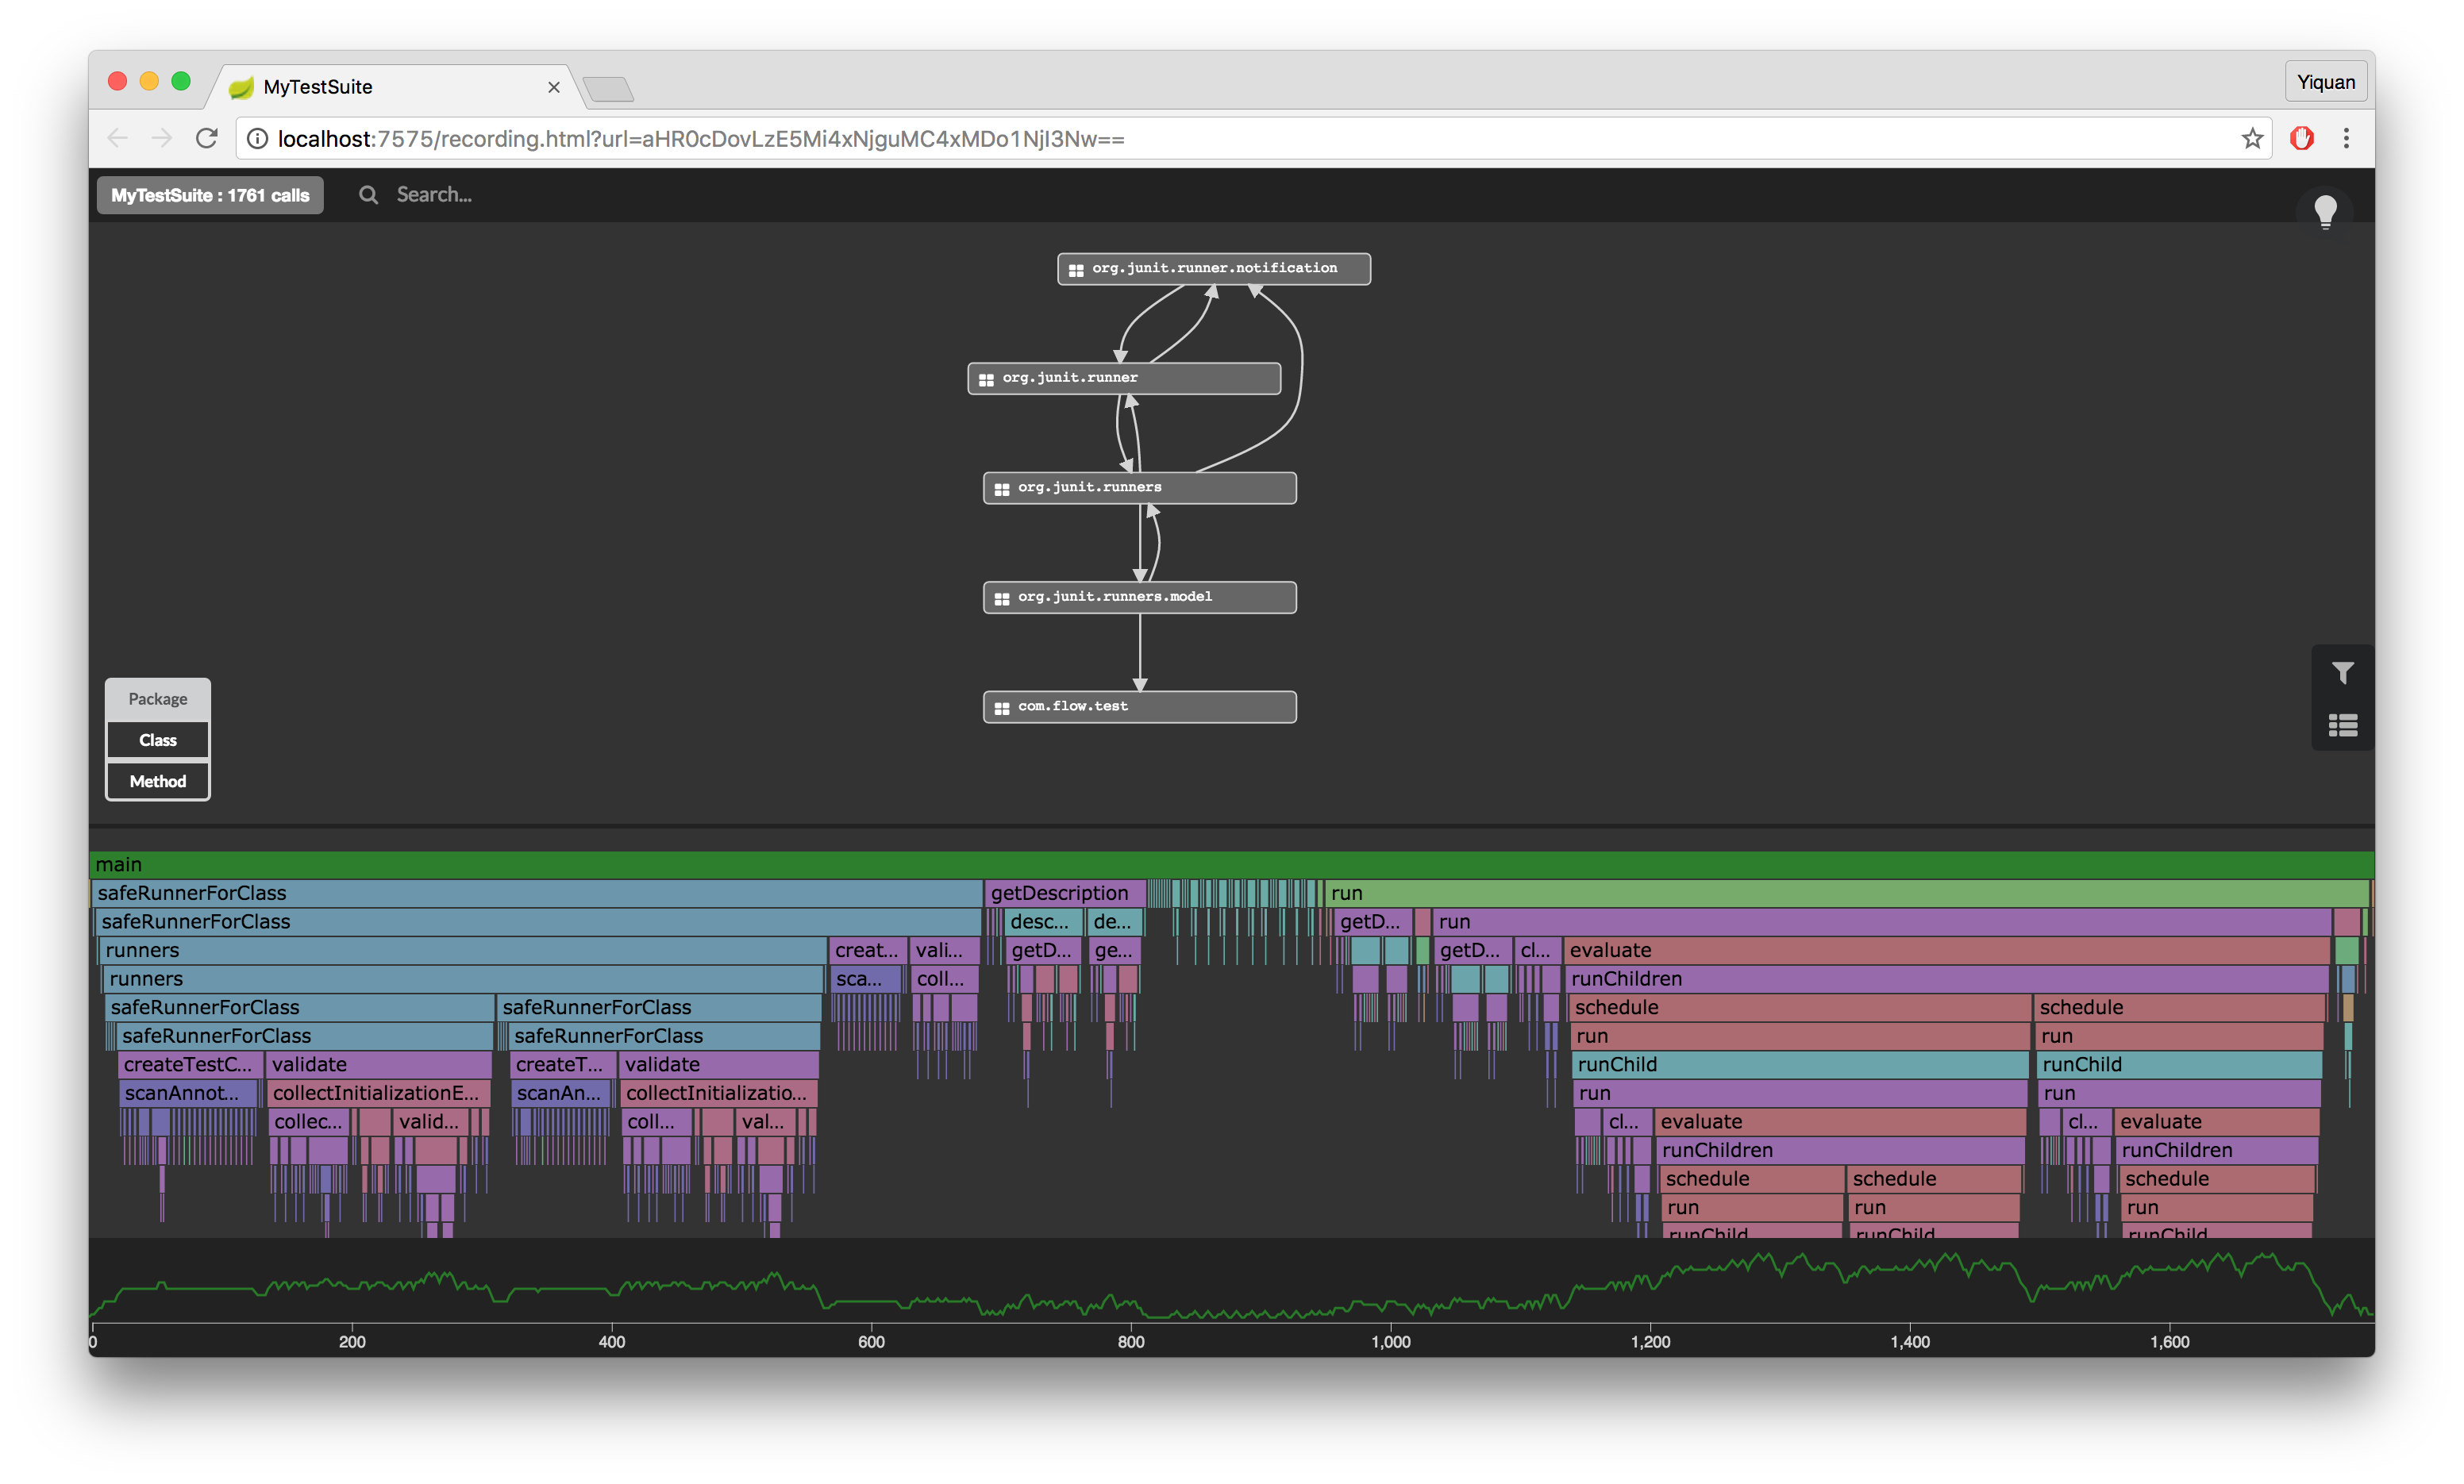
We can easily see in the flame chart that two TestClass are created for the execution of the test suite, one for each test case.
A new runner Suite is used which is the other default implementation of ParentRunner for a test suite.
We will still find the BlockJUnit4ClassRunner.runChild() this time deeper in the stack.
Conclusion
Now we have quite good idea on the roles of runners in the test execution process. It should be much easier for us to create our own custom runner.
You can also take a look at some well known examples of runners such as SpringJUnit4ClassRunner or MockitoJUnitRunner.
Eclipse Che Dashboard
Context
Let’s pretend I just got hired as a developer by Codenvy.
My manager tells me I’ll be working on Eclipse Che, the open-source core of Codenvy, and my first few assignments will be about fixing bugs and adding new features to the dashboard (mainly back-end side).
Exciting but where do I start?
I could do what I usually do when I start working on a new project:
-
Clone the source repository
-
Import relevant projects into my favorite IDE like dashboard (front-end) or wsmaster (one of the back-end projects)
-
Browse the source code
I could also take a look at their automated tests and run them with a debugger.
But this time I want to do things differently. Before anything else, I want to run Eclipse Che and focus on one single scenario: the opening of the dashboard. My goal is to better understand how the front-end interacts with the back-end and most importantly what’s going on in the back-end. For that I’ll use Flow. With Flow I can record the execution of any application running on the JVM and then visualize what happened in my web browser.
Setup
I won’t build Eclipse Che from scratch and instead I’ll download the latest binaries (Eclipse Che 4.0.0 RC 11).
Running Che is pretty easy:
eclipse-che-4.0.0-RC11/bin$ ./che.sh run
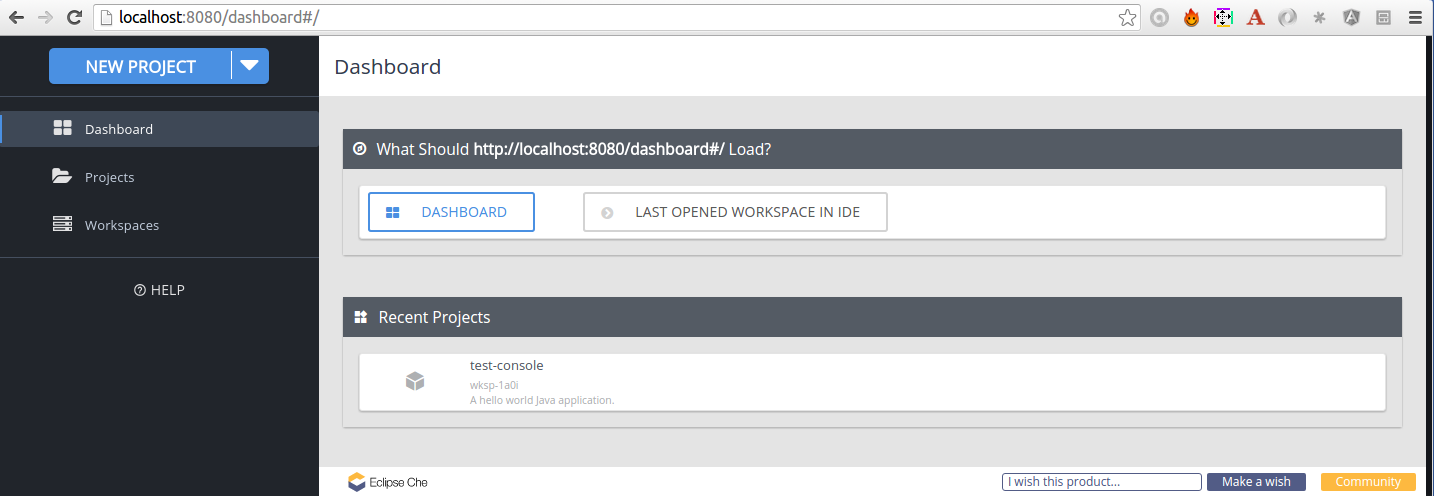
The dashboard is now available at http://localhost:8080/dashboard.
What I want now is to use Flow on Eclipse Che.
Once I downloaded and unzipped the Flow archive, I can run it:
flow$ ./flow
I know it’s ready when I get:
Starting Flow...
Flow is ready on http://app.findtheflow.io (Ctrl+C to stop it)
Now I need to attach the Flow java agent to the JVM running Eclipse Che.
Looking at the content of eclipse-che-4.0.0-RC11/bin/che.sh, I find out that Che runs on a Tomcat ("catalina" = Tomcat):
${ASSEMBLY_BIN_DIR}"/catalina.sh ${CHE_SERVER_ACTION}
And sure enough I can find a Tomcat sitting at eclipse-che-4.0.0-RC11/tomcat.
In eclipse-che-4.0.0-RC11/tomcat/bin, I’ll create a new file named catalina-flow.sh with the following content:
#!/bin/bash
export JAVA_OPTS="-javaagent:/path/to/flow/flowagent.jar -Dflow.agent.include=org.eclipse.che $JAVA_OPTS"
`dirname $0`/catalina.sh $@
|
Note
|
I use the -Dflow.agent.include=org.eclipse.che system property to only instrument classes under the org.eclipse.che package.
|
And I replace "catalina.sh" by "catalina-flow.sh" in eclipse-che-4.0.0-RC11/bin/che.sh.
After making sure I terminated Eclipse Che, I can now start it again, and this time it will run with the Flow java agent attached.
Investigation & Findings
I open http://app.findtheflow.io, and I notice that the Record button is enabled. I click it,
refresh http://localhost:8080/dashboard, and once it’s fully loaded I click the Stop button. Shortly after I get this:
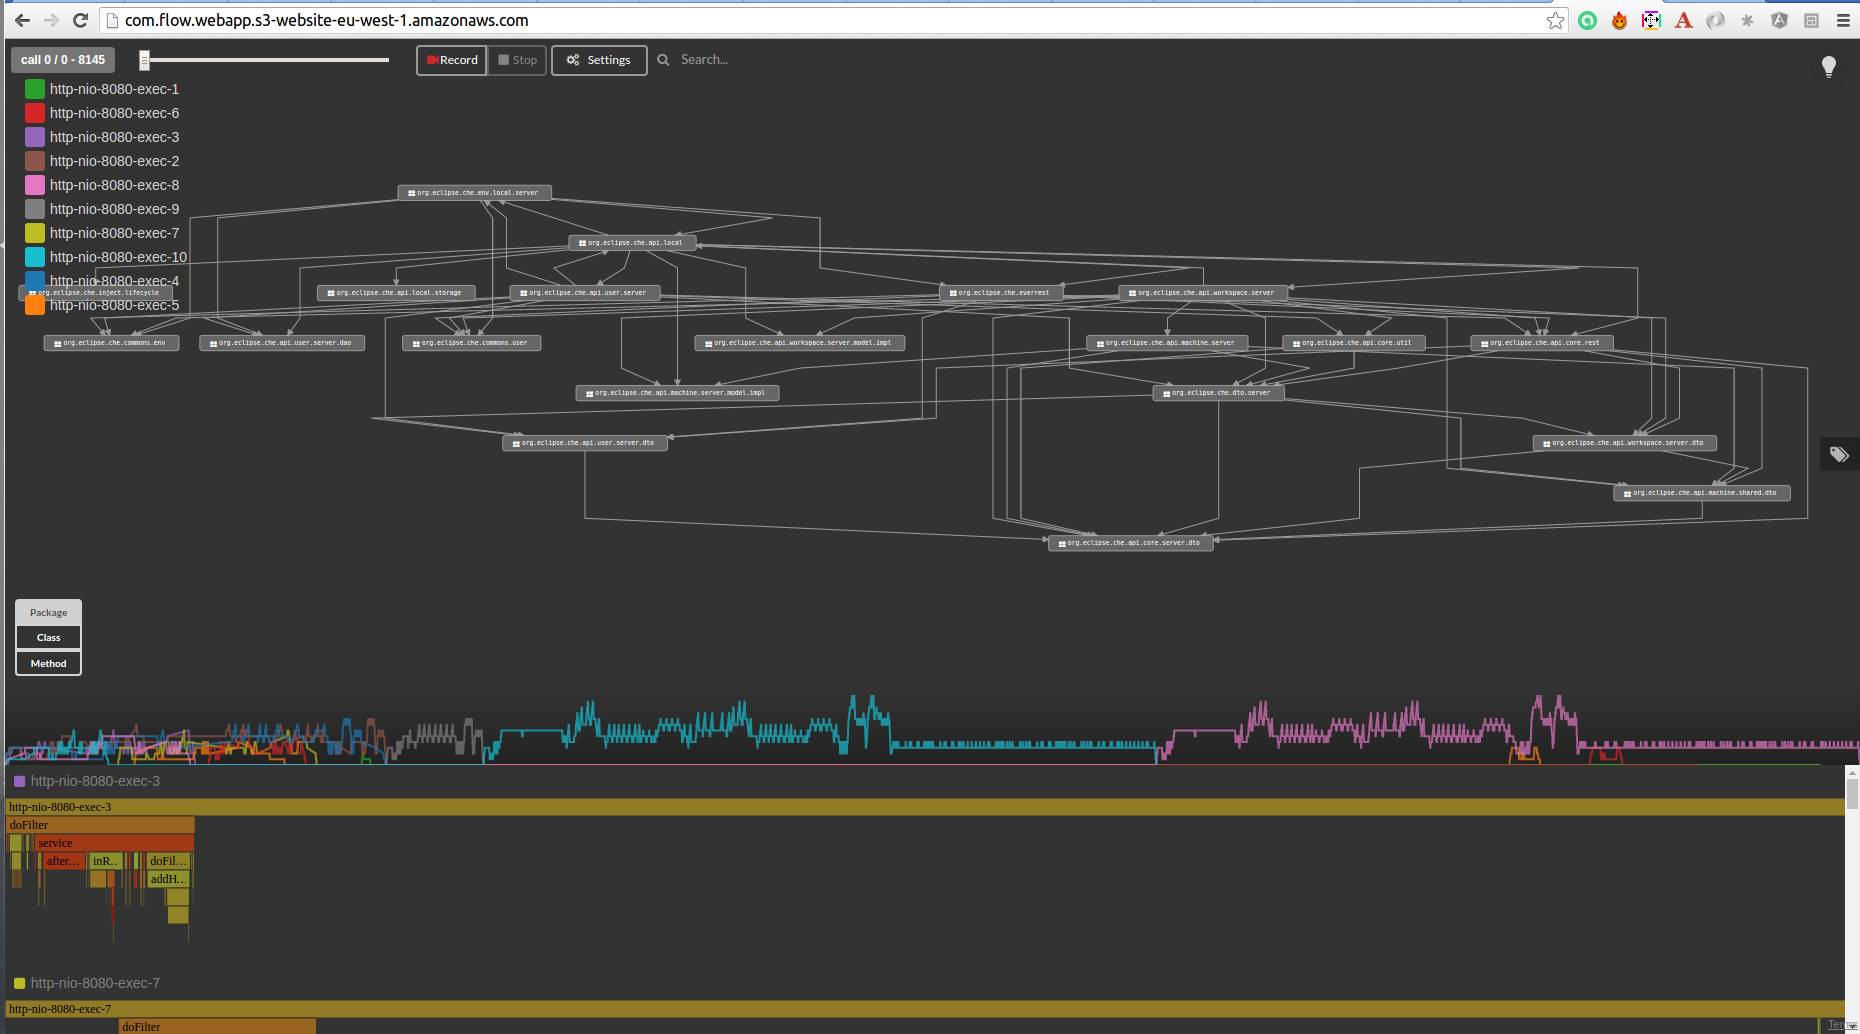
A visual and explorable representation of what happened in the JVM during that scenario (across all the web applications deployed to the Tomcat).
I can see the structure: packages, classes, and methods. And I can see the behavior: threads and method calls through time.
One thing immediately catches my attention: I notice the same exact pattern in the timeline:

Two threads, one after the other, probably did the same or very similar work. After zooming in on these two threads in the flame diagram, I can confirm that this is the case.
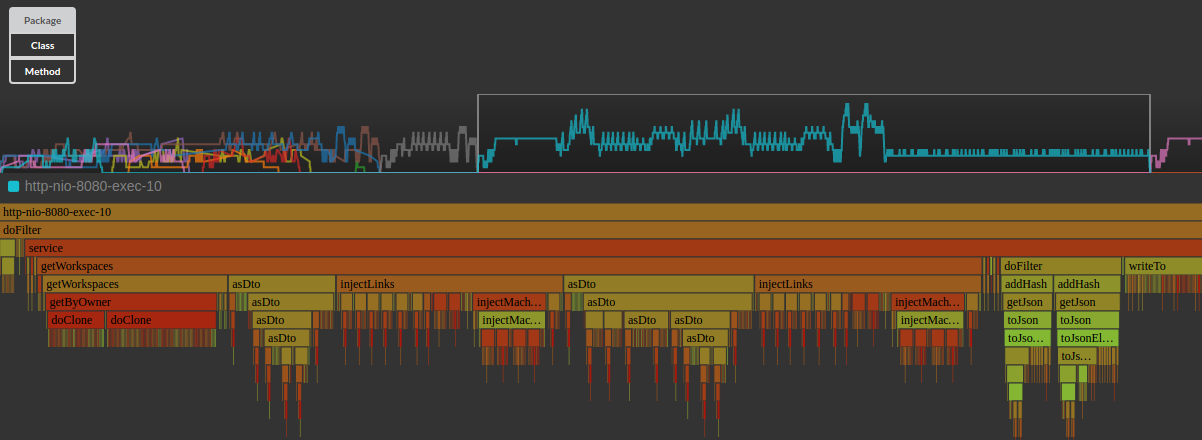
They both seem to get the workspaces of a given owner. Interesting. Now let’s see what requests the front-end makes to the back-end. I just need to open Chrome dev tools and refresh the dashboard.
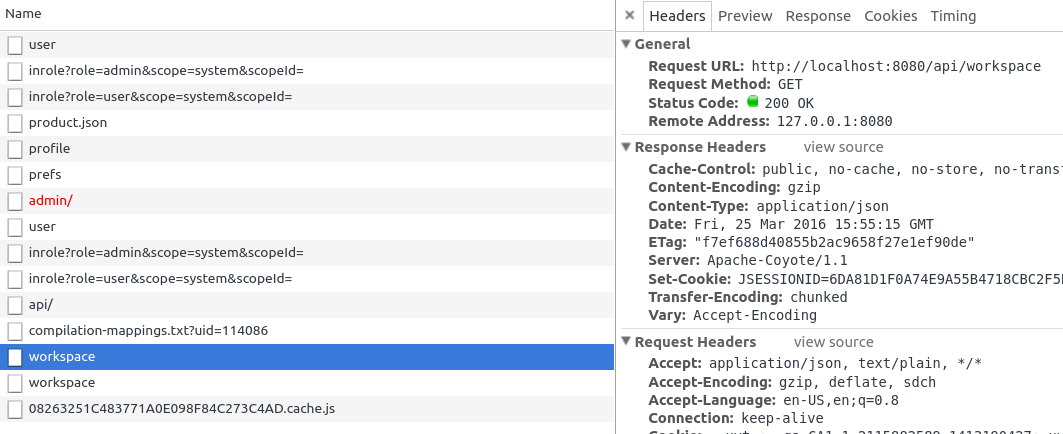
I can see two exact same requests made back-to-back to the /api/workspace endpoint. After quickly glancing at the Eclipse
Che REST API, I get that its purpose is to get the workspaces owned by the current user.
That confirms what I saw in Flow.
My guess is that two different components of the web application need the list of workspaces. I could find them by looking into the JavaScript code but I can’t because I got a production version of Eclipse Che where the source code is minified.
In any case, it seems to me this list of workspaces could be cached either on the client or server side (especially since the server already returns ETags).
I guess it’s now time to get back to my teammates and tell them more about my findings!