System requirements
-
Flow requires java 1.8+ to run (it was not tested on 9)
-
Flow should work with Open and Oracle JDK/JRE
-
IBM JDK/JRE is not supported at the moment
-
If you use the Flow plugin for IntelliJ, it will run with the JDK/JRE that IntelliJ runs with
-
-
Flow can record applications running with java 1.7+
How to install Flow plugin for IntelliJ?
Installation
You can find the Flow plugin in IntelliJ by going to Preferences / Settings → Plugins → Browse repositories…
Install it and restart IntelliJ.
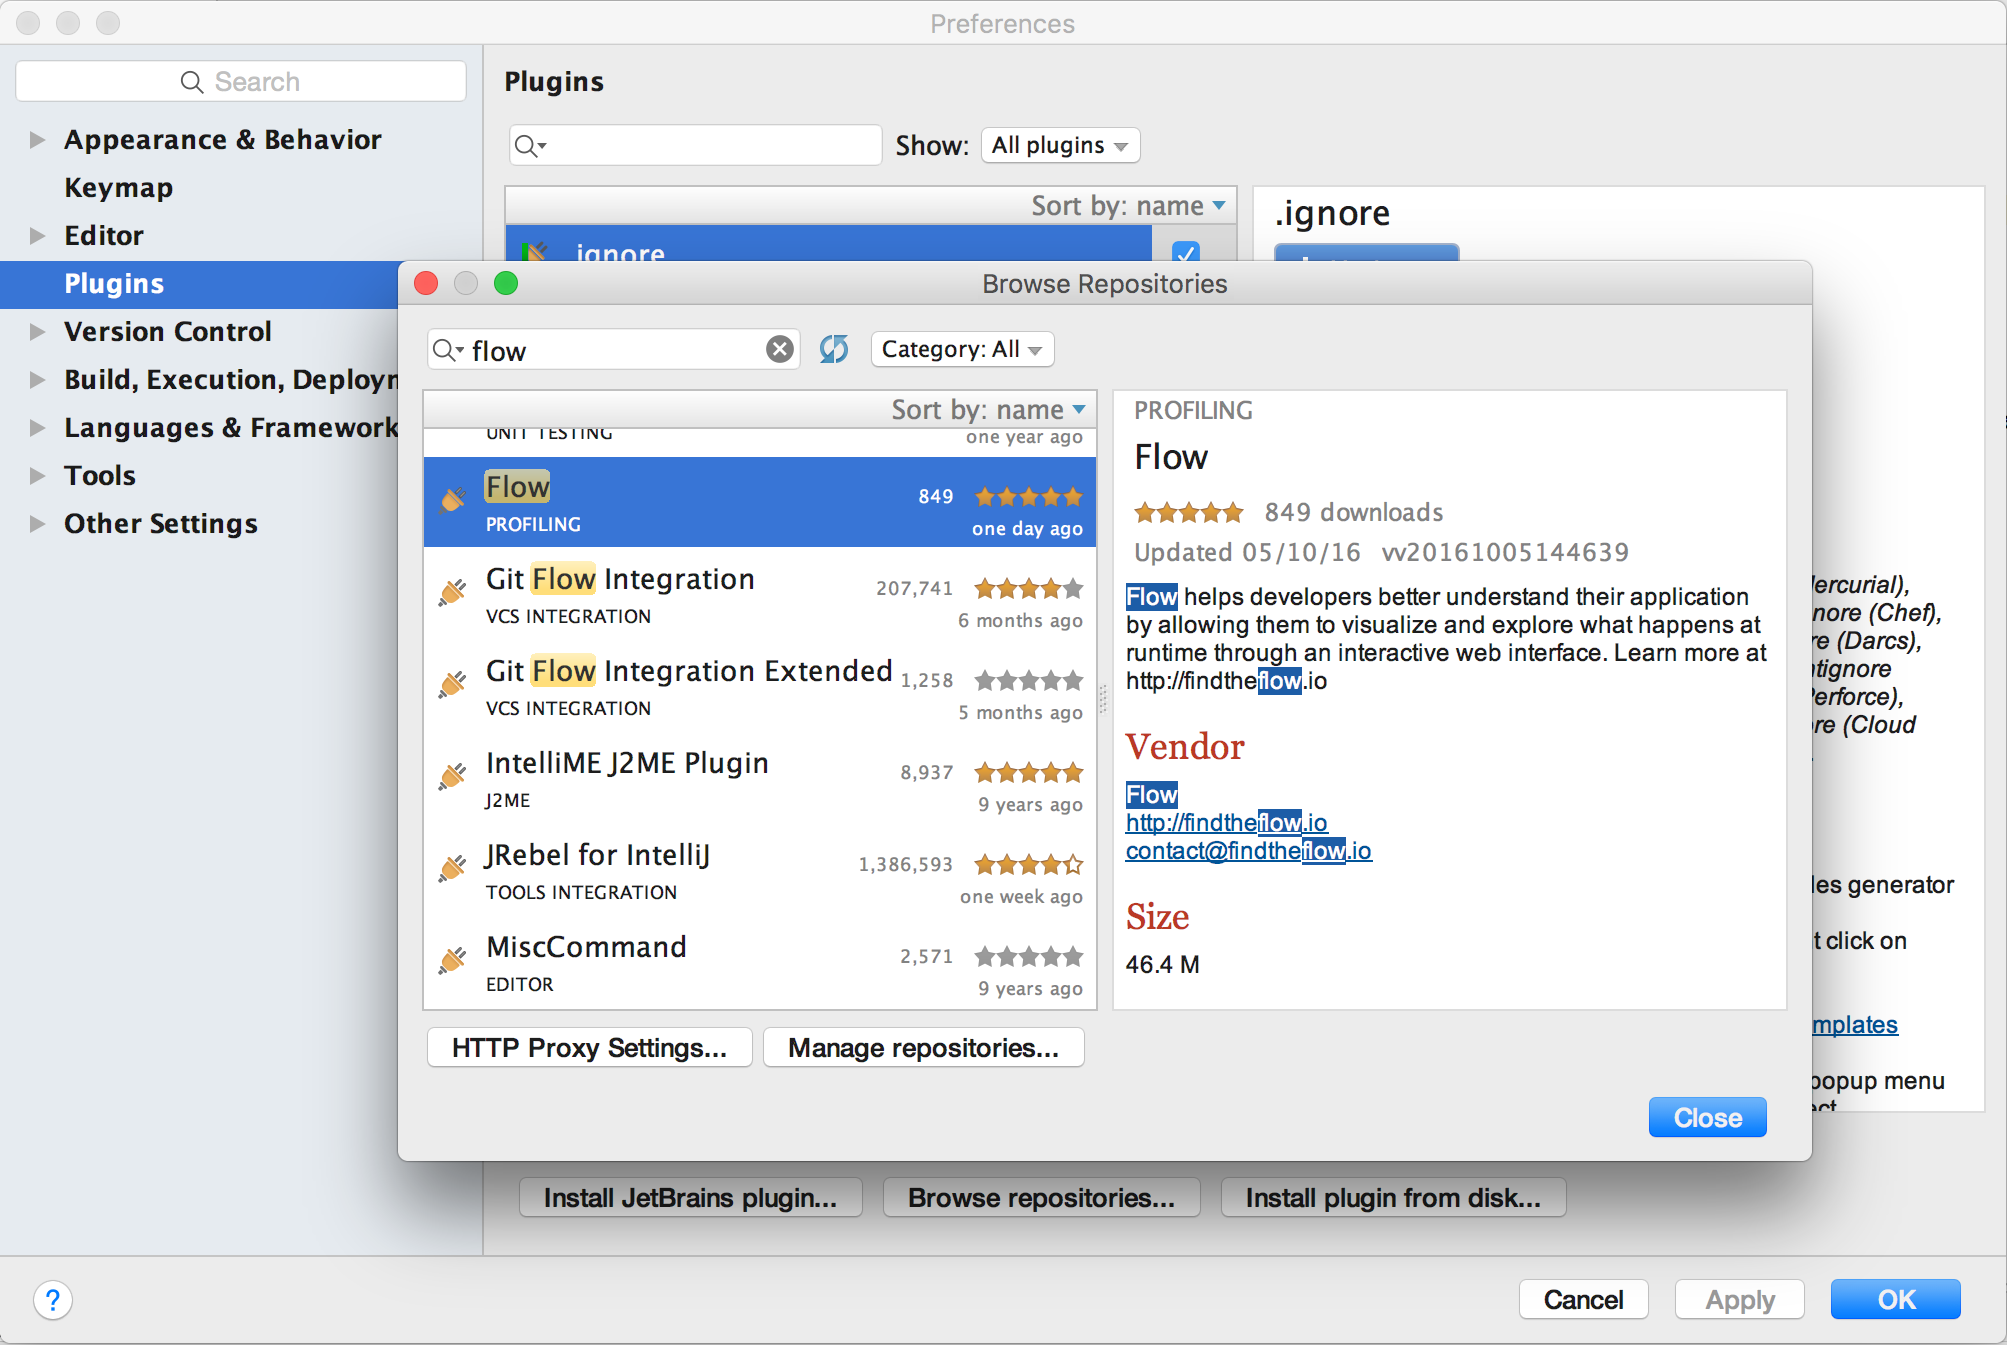
You can also download the plugin from the IntelliJ plugins website and install it from disk.
Startup
Flow will start automatically at the startup of IntelliJ so you don’t have to do anything. A message "Flow is ready" will appear in the Event Log when it’s started.
| When Flow starts the first time, it may take up to a few minutes to download some additional jars. |
Troubleshooting
-
I get an error message "Flow failed to start", what can I do?
-
Make sure to update to the latest version of the plugin (we may have fixed your issue!)
-
Restart IntelliJ (this will restart Flow)
-
Make sure that the following ports are not already being used: 7575, 52354, and 3571
-
If it is still not working, please send us a bug report by clicking the link in the error message
-
How to run an application with Flow from IntelliJ?
Configurations
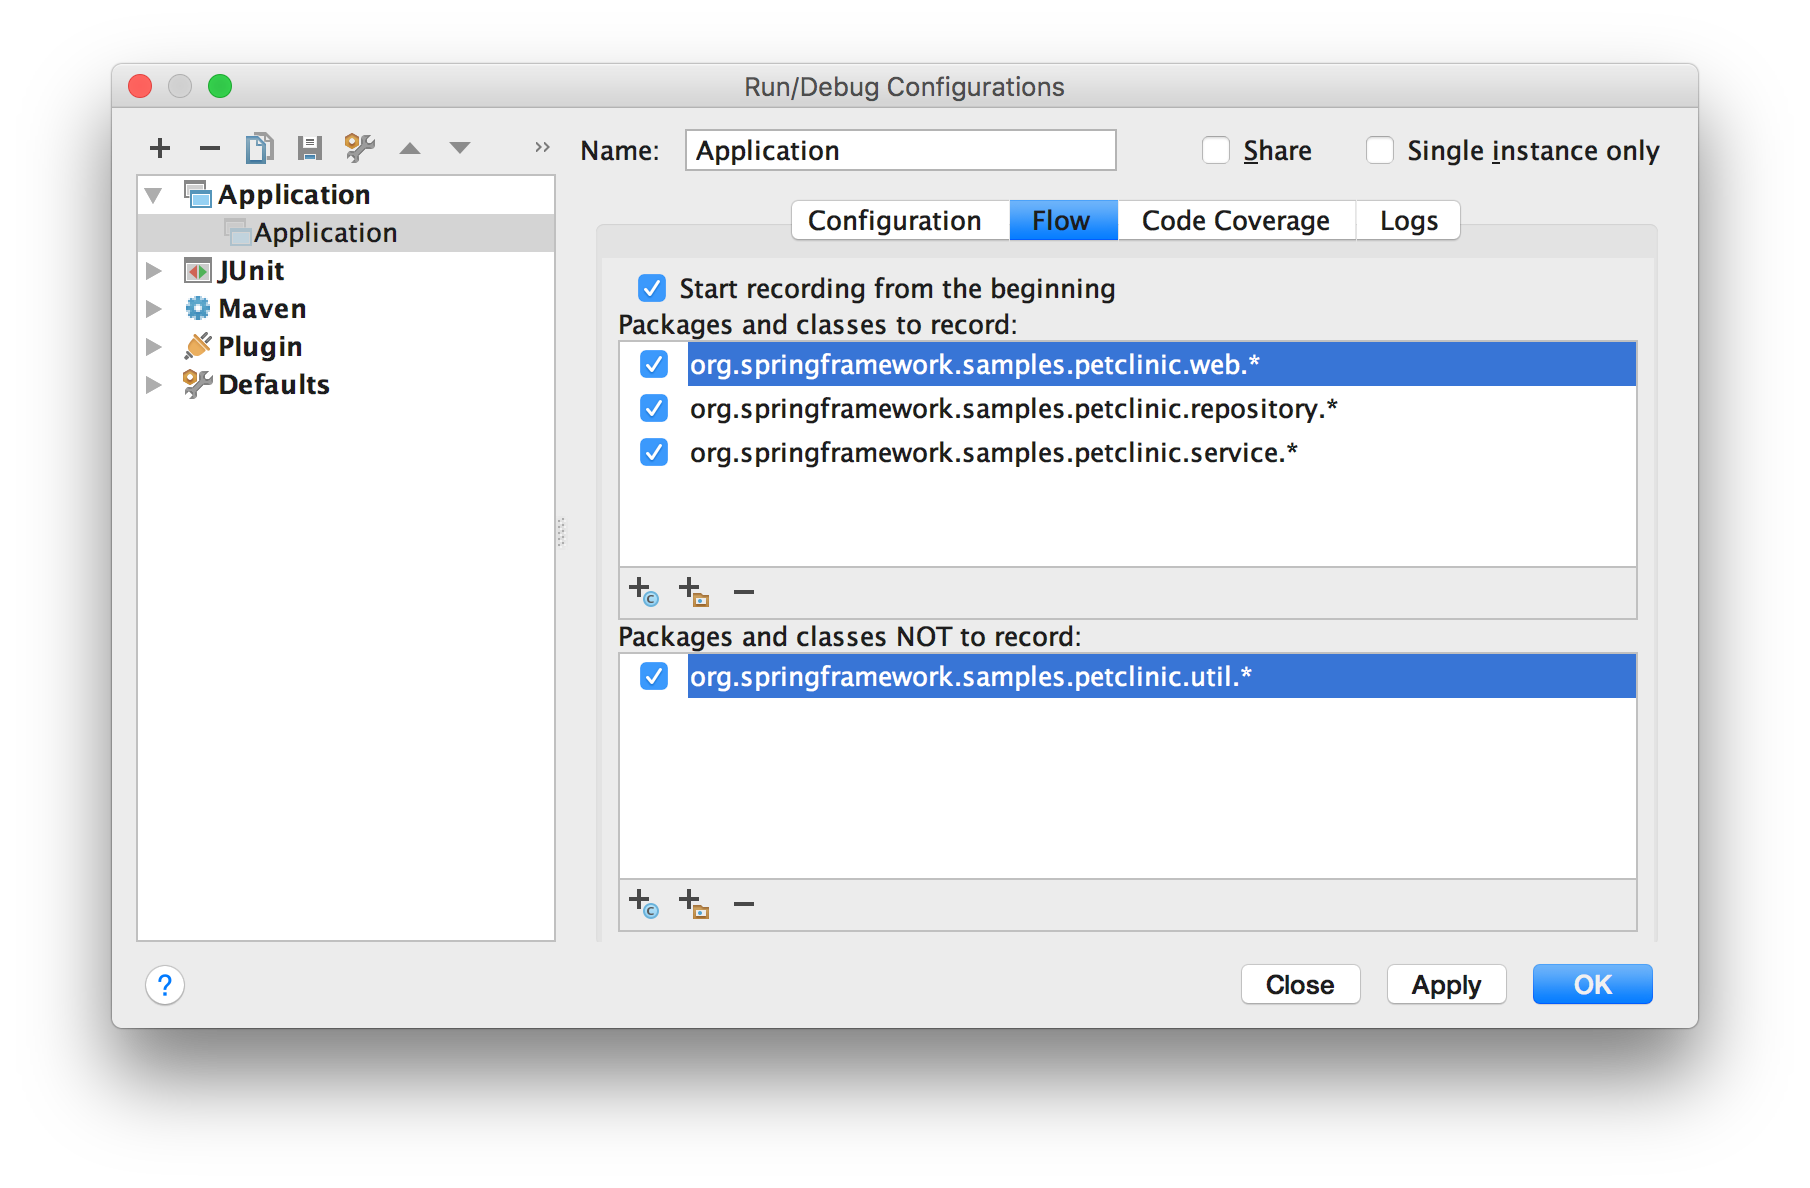
Once you have installed the Flow plugin, you will find a Flow tab in the Run/Debug Configurations. It is currently enabled for Application, JUnit and local application server configurations.
| Remote connection to servers is not supported. |
-
Start recording from the beginning (checkbox): if checked, the recording will start from the beginning of the execution, which is typically useful when running a unit test. Otherwise the recording can be started manually from the webapp.
-
Packages and classes to record: a list of packages and classes to be instrumented.
Core java libraries cannot be instrumented (i.e. 'java', 'javax', 'sun', 'com.sun'). Classes to be instrumented should NOT be in the default (empty) package. -
Packages and classes NOT to record: a list of packages and classes NOT to be instrumented.
Run applications with Flow
Run the application with Flow by using the record button in the toolbar
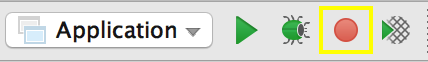 or through the Run menu.
Troubleshooting
-
"At least one package should be recorded": make sure that at least one package is present in the list of packages and classes to record (Flow tab of the run configuration).
-
JBoss/Wildfly: "The LogManager was not properly installed" and similar errors
Add the following JVM options to your run configuration:
-Djava.util.logging.manager=org.jboss.logmanager.LogManager
-Xbootclasspath/p:{JBOSS_HOME}/modules/system/layers/base/org/jboss/logmanager/main/jboss-logmanager-{LOG_MANAGER_VERSION}.Final.jar
-Djboss.modules.system.pkgs=org.jboss.logmanager,com.flow.agent
Make sure to replace {JBOSS_HOME} either by %JBOSS_HOME% (Windows) or $JBOSS_HOME (Linux and Mac) and {LOG_MANAGER_VERSION} by the version you find in the corresponding folder.
How to use Flow standalone version?
| We recommend you to use Flow in standalone mode only if you do not run your application from IntelliJ. You can skip this section if you are using Flow plugin for IntelliJ. |
Download and Installation
Download the standalone version of Flow. Unzip it to any place you like.
Startup
Run Flow standalone version with command:
java -jar flow-${version-number}.jarYou will see the message below when Flow is started.
$ java -jar flow-20180402083612.jar
______  _
|  ___|| |
| |_   | |  ___  __      __
|  _|  | | / _ \ \ \ /\ / /
| |    | || (_) | \ V  V /
\_|    |_| \___/   \_/\_/

Flow is starting...

Flow is ready.
Configure and run your application with Flow
You need to run your application with the following VM options:
-
-javaagent:${user-directory}/.flow/resources/javaagent.jar -
-Dflow.agent.include=com.foo: packages and classes to include to the recording (comma-separated) -
-Dflow.agent.exclude=com.foo,com.bar.Baz(optional): packages and classes to exclude from the recording (comma-separated) -
-Dflow.agent.autostart(optional): record the application from the beginning -
-Dflow.agent.execution-name=myapp(optional): execution and recording name displayed in the Flow webapp
How to record an execution?
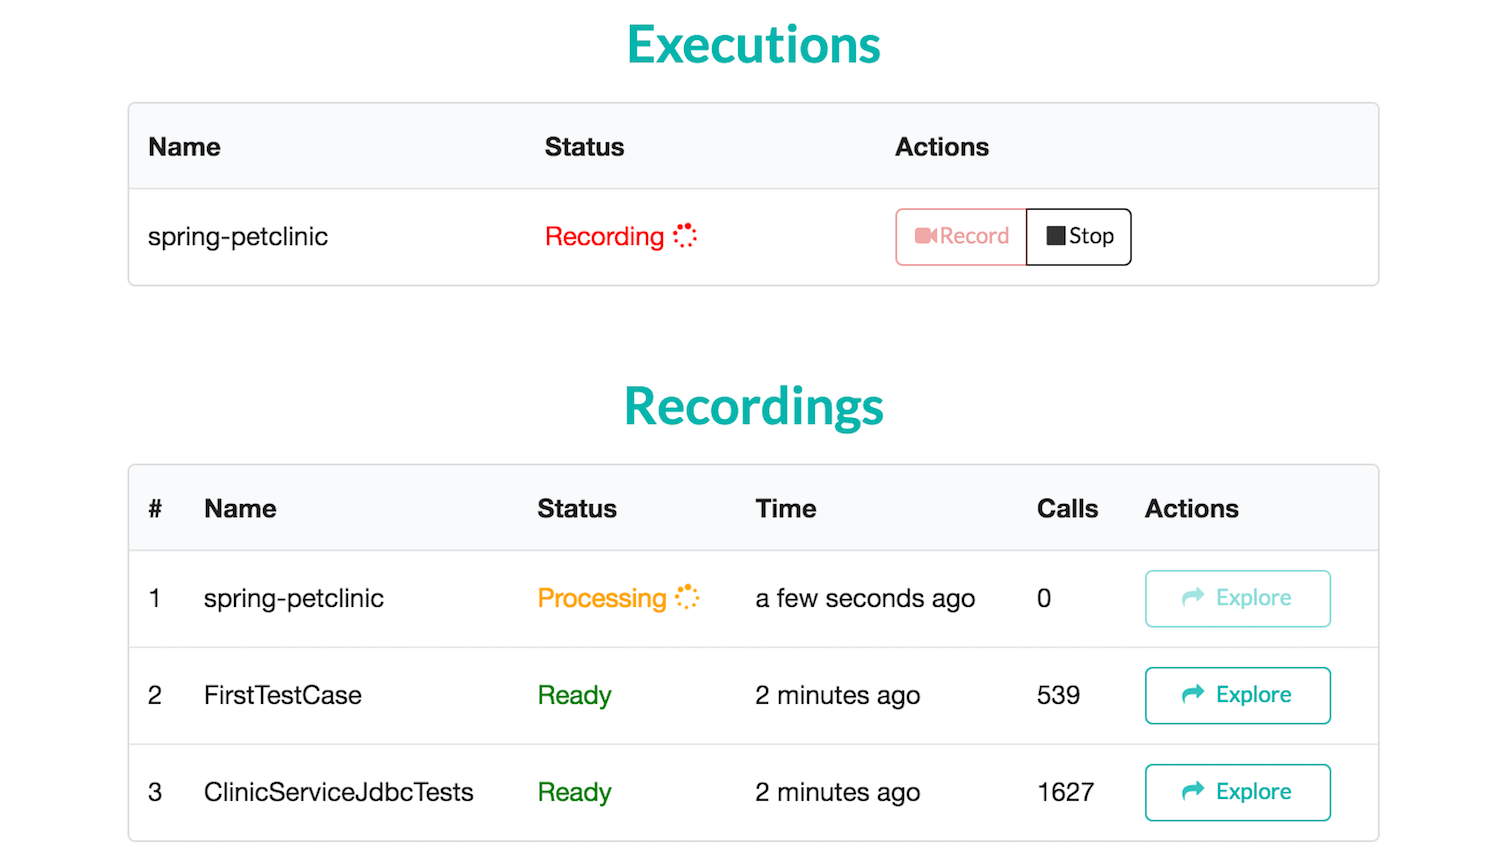
The “Executions” section displays all the executions run with Flow.
-
An execution is recorded automatically from the beginning if the Start recording from the beginning option is checked in the Run Configuration.
-
The recording is stopped automatically when the execution stops.
-
You can start and stop recording part of an execution manually with the Record and Stop buttons.
For example, if you want to know how a web application works when you submit a form on the UI, you can start the recording, then submit the form and stop the recording after the form is submitted. If you want to know how a REST API is implemented, you can simply start the recording, send a request to that API and then stop the recording.
How to record a test?
This demo video shows how to record a test with Flow.
How to record a web application?
This demo video shows how to record a scenario in a web application with Flow.
A recording contains 0 calls, what happened?
-
Verify the packages and classes to record in the Flow tab of the Run Configuration:
-
Make sure that they are not in the default (empty) package
-
At least one method belonging to those packages and classes should be executed as part of the run.
-
-
If the scenario is recorded manually, make sure that the scenario is played after the record button is clicked. Wait until all the operations are fully performed before stopping the recording.
-
Make sure the execution that you want to record does not run remotely. For example, if you record a test that invokes a REST API, only the execution on the client side will be recorded. If you are interested in what happens on the server side, you need to run the server application with Flow and record manually the execution when the test runs.
-
It simply tells you that none of the methods in the instrumented packages have been called in the recorded scenario!
A recording contains too many calls, what can I do?
-
Shorten the scenario
-
Record one test at a time instead of a whole test case or a test suite.
-
Record one operation at a time: a page view, a button click, a form submission, an API call etc.
-
Pay attention to the volume of data involved in the scenario you want to record. A large dataset can potentially generate a large number of calls and it’s usually not really helpful to understand how a piece of code works. Reduce the dataset if necessary.
-
-
Restrict the recording to more specific packages
-
An application is often composed of multiple modules identified by different package names:
com.mycompany.myapp.moduleA,com.mycompany.myapp.moduleB. You can start with one specific module to understand how it works. -
An application can also contain multiple layers identified by different package names:
com.mycompany.myapp.model,com.mycompany.myapp.controller,com.mycompany.myapp.viewetc. You can start with one or more specific layers to understand how it works. -
Sometimes some packages or classes doing recurrent operations may produce large numbers of calls. If you can identify these packages or classes in the recording, you can exclude them in the Run Configuration and make a new recording.
-
Explore the visualizations
Call Graph
This is a dynamic call graph of the recorded execution:
-
There are three levels of call graph: package, type, and method.
-
A node represents an artifact (a package, a type or a method) of the program at each level.
-
The edges are directed, and represent the calling relationships between the artifacts.

Call Stack
The Call Stack view provides a highly synthetic view of method calls in the execution.
-
The x-axis shows the execution time.
-
The y-axis shows the call stacks.
-
Each box represents a method call in the stack (a stack frame).
Timeline
This is a minified view of all the threads and events of the recorded execution:
-
Each thread is represented by a colored line.
-
The x-axis shows the execution time.
the execution time is not the real timestamp but a discrete symbolic time. The calling to a single method counts time 1. And it gets incremented if this method calls other methods. -
The y-axis is the depth of the call stacks.
Time window
You can focus on a particular time window when there is a lot of data, by
-
selecting a segment of the timeline:

-
double clicking a method call in the Call Stack:
IntelliJ integration
When using the Flow plugin for IntelliJ, you can either use the context menu ("Go To Source in IDE") or Ctrl-Click on a class, method, or call to open them in IntelliJ.